We don't normally run full articles from elsewhere, but since I'm on the road with very limited time online, and since this item is so important right now and of note to so much that we've covered here over the years (take a look at our Special Coverage page on ACVR to get a taste), I'm making an exception and taking the liberty.
The following is from Josh Marshall at TPM, and was originally published here yesterday. Click through the links below for much more detail!...
The truth is that if you're an educated and reasonably well-off person who has time free to read about politics during the day at TPM you very likely have one or more pieces of ID, in all likelihood a driver's license. But among minorities, low-income voters, the young and the old that's often not the case. And those who don't have acceptable voter IDs are disproportionately Democrats.
Remember, the point of voter ID laws is not to eliminate fraud it is to eliminate Democratic voters. So if your voter ID law disenfranchises 10% of voters and 80% of those are Democrats you've just handed yourself several percentage points that can win you a bunch of close elections --- it's certainly easier than winning them the old fashioned way.
In any case, I return to this topic because one of these laws has been enacted in Indiana. And the Brennan Center and others have filed an amicus brief with a new quantitative study which finally puts real numbers on how many people will effectively lose their right to vote.
I'm quoting here from the press release on some of the study's key findings ....
# When non-registered eligible voter responses are included - the gap widens. 28.3% of eligible black voters in the State of Indiana do not have valid photo ID (compared to 16.8% of eligible voting age white Indiana residents - a gap of 11.5 percent).
# The study found what it termed "a curvilinear pattern (similar to an upside down U-curve)" in the relationship between age and access to valid ID - younger voters and older voters were both less likely to have valid ID compared to voters in the middle categories. 22% of voters 18-34 did not have ID, nor did 19.4% over the age of 70. (compared to 16.2% of Indiana voters age 35-54 without valid ID and 14.1% for 55-69 year olds).
# 21% of Indiana registered voters with only a high school diploma did not have valid ID (compared to 11.5% of Indiana voters who have completed college - a gap of 9.5%).
# Those with valid ID are much more likely to be Republicans than those who do not have valid ID. Among registered voters with proper ID, 41.6% are registered Republicans, 32.5% are Democrats.
The study puts in a very stark relief what the Republican effort to keep minority and low-income voters from the polls is really about. And the Supreme Court will soon sign off on whether this is permitted --- a decision that will have a huge effect on voting rights in this country for years to come. Please take a moment to check out the press release and find out more.


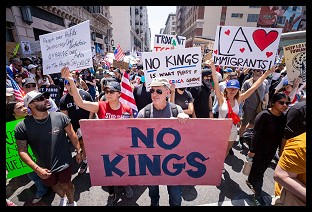 With Thanks, No Kings and Good Cheer
 Presidential Illegality and the Duty to Disobey
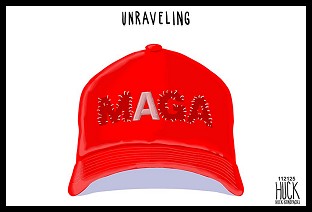 Sunday 'Leave 'em in Stitches' Toons
 President of United States Calls for Killing Democratic Officials: 'BradCast' 11/20/25
 'Green News Report' 11/20/25
 Is MAGA Finally Beginning to Fall Apart?: 'BradCast' 11/19/25
 Trump's Terrible, Horrible,
 'Green News Report' 11/18/25
 A Kaleidoscope of Trump Corruption: 'BradCast' 11/17/25
 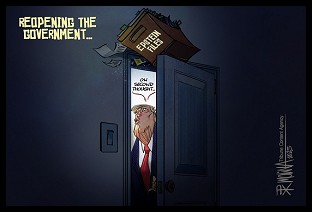 Sunday 'Back to Business' Toons
 Trump DOJ Takes Stand
 'Green News Report' 11/13/25
 Mamdani's 'Surprisingly Affordable' Afford-ability Agenda for NYC: 'BradCast' 11/12
 After the Shutdown and Before the Next One: 'BradCast' 11/11/25
 'Green News Report' 11/11/25
 Victories for Democracy in Election 2025; Also: 7 Dems, 1 Indie Vote to End Shutdown in Senate: 'BradCast' 11/10/25
 Sunday 'Ass Kicking' Toons
 'We Can See Light at the End of the Tunnel' After Election 2025: 'BradCast' 11/6/25
 'Green News Report' 11/6/25
 BLUE WAVE! Dems Win Everything Everywhere All at Once: 'BradCast' 11/5/25
 Repub Thuggery As Americans Vote: 'BradCast' 11/4/25
 Last Call(s) Before Election Day 2025: 'BradCast' 11/3/25
 A Pretty Weak 'Strongman': 'BradCast' 10/30/25
 Proposal for 'Politically Viable Wealth Tax' Takes Shape in CA: 'BradCast' 10/29
 Monster Storm, Endless Wars, Gamed Elections: 'BradCast' 10/28/25
 Let's Play 'Who Wants to Be a U.S. Citizen?'!: 'BradCast' 10/27/25
 Exiled NOAA Scientists Resurrect Critical Disaster Database: 'BradCast' 10/23/25
 VA GOP VOTER REG FRAUDSTER OFF HOOK
 Criminal GOP Voter Registration Fraud Probe Expanding in VA
 DOJ PROBE SOUGHT AFTER VA ARREST
 Arrest in VA: GOP Voter Reg Scandal Widens
 ALL TOGETHER: ROVE, SPROUL, KOCHS, RNC
 LATimes: RNC's 'Fired' Sproul Working for Repubs in 'as Many as 30 States'
 'Fired' Sproul Group 'Cloned', Still Working for Republicans in At Least 10 States
 FINALLY: FOX ON GOP REG FRAUD SCANDAL
 COLORADO FOLLOWS FLORIDA WITH GOP CRIMINAL INVESTIGATION
 CRIMINAL PROBE LAUNCHED INTO GOP VOTER REGISTRATION FRAUD SCANDAL IN FL
 Brad Breaks PA Photo ID & GOP Registration Fraud Scandal News on Hartmann TV
  CAUGHT ON TAPE: COORDINATED NATIONWIDE GOP VOTER REG SCAM
 CRIMINAL ELECTION FRAUD COMPLAINT FILED AGAINST GOP 'FRAUD' FIRM
 RICK SCOTT GETS ROLLED IN GOP REGISTRATION FRAUD SCANDAL
 VIDEO: Brad Breaks GOP Reg Fraud Scandal on Hartmann TV
 RNC FIRES NATIONAL VOTER REGISTRATION FIRM FOR FRAUD
 EXCLUSIVE: Intvw w/ FL Official Who First Discovered GOP Reg Fraud
 GOP REGISTRATION FRAUD FOUND IN FL


